The Future of M&A in 2012


According to Merrill Datasite’s recent “Monthly M&A Insider, April 2012” report, M&A “activity [inNorth America] declined in Q1 2012 with 873 deals valued at $149B, a 9.9% decrease in volume and 26% decrease in value when compared to the same time last year.”

What they don’t say is that Q4 to Q1 figures can typically trend down as the rush to close a deal by year-end falls off in Q1, and builds up again during the year. And if you delve deeper into the report you will find activity is flat -to-down in nearly every first quarter since 2006, so I discount Q1 2012 in the same way.

But this does not mean CEOs should sit back and wait around until things pick up this year. Strategic deals are the cats meow in 2012 with over $3 Trillion in excess cash on corporate balance sheets looking for M&A deals. Add to that on the Sponsorship side another $400Bil from Private Equity Funds looking to deploy that cash and I view the pump as altogether well primed to go. So what are we waiting for?

What I keep hearing from corporate execs is “uncertainty” is paralyzing the Board against taking only the most obviously easy to swallow deals, like the announcement of Kelloggs buying Pringles for $2.7Bil from P&G after Diamond Foods backed out. Not a real head turner decision for a strategic thinking Board to make.

The future of M&A now lies in 2 Worlds, the one in which CEOs can see and calculate a confident deal road ahead, and the other, which blinds CEOs, freezes them in their tracks, and paralyzes their muscles, like a deer in headlights. Ever wonder what that deer must be thinking just then?

I characterize this paralysis as a Tug of War game in the CEO suite going on right now between two opposing sides of advisors to the Board and the CEO. One side sees more clearly in their world the ‘what and how’ to measure a deal-launch sequence, while the other side sees chaos, and firmly pulls back hoping to paralyze the Board and Chief exec. This paralyzing intersection of indecision can stretch apart or destroy an important chance at a longer term value proposition a CEO may need down the line. Make sesnse?Just remember; “Fear is the mind killer” [Dune 1984].

In my next article, to be published in May, I drill down specifically on the Top 10 M&A Deal Drivers in this 2012 Tug of War room from a CEO vs Advisor perspective, and then ask you, which side of the rope should you be on?  Stay tuned…

 Rick Andrade

Wow! Lowest New Business Start-ups On Record?

Dateline Feb 14, 2012 – Valentine’s Day!

And here we go again. As if M&A isn’t tough enough these days convincing people to pull the trigger on a new deal opportunity a recent report from Challenger Gray & Christmas reported the number of new start-up businesses from formerly employed people dropped off quite a bit in 2011 to its lowest rate on record (3.2%). http://www.challengergray.com/press/PressRelease.aspx?PressUid=213.

But honestly — what does this mean?

A look behind the headline begs a look at what drives these figures in the first place. For instance, the report also cites that as employers start hiring again and business confidence climbs back, less formerly employed people start new businesses. Now that makes sense. Why risk uncertainly and your own money in a risky entrepreneurial venture when your prospects for getting a new job are increasing faster than the economy demands you start a new business, right?

At the same time I have not seen a precipitous drop in buying existing businesses for sale, so possibly the newly unemployed may not be starting new businesses, rather buying one already in business. According to Bizben the number of exiting business purchases from 2010 to 2011 increased 4.6% http://www.bizben.com/stats/stats-total.php. Nothing dramatic about that but not drop either. Another interesting distinction is the skill gap inAmerica today as many formerly employed workers don’t have the new skills to start a new business putting them on the sidelines perhaps like no time in history before. Another reason former workers may not be starting new businesses.

So there is a gap and perhaps a flaw in headlining a historical drop in new business start-ups from one source (former employees) and making hay of it. To me the market dynamics behind the scenes are far more complex in a shifting global economy than meets the eye. I believe in simple supply and demand. And as a SBA/SCORE counselor to new start-ups and exiting businesses I see what I expect to see, and that is people who need to work don’t just start a new business because they need to, rather when they have to use their own money they are far more certain to check the demand curve to measure their chances of success before jumping in. The lesson here is in order to get the whole story it’s always best to look behind the headlines.

Rick Andrade

The State of Capital Markets in 2012

 As a member of ACG (Association for Corporate Growth) here inLos Angeles, we get a chance each New Year to gather and hear from a panel of experts on the cost and accessibility of money in 2012.

The event on January 4th was appropriately headlined too, The State of Capital Markets in 2012, and well attended with 3 panelists I really wanted to hear from. Jason Horstman Sr VP at Union Bank talked about Senior lending, Jeri Harman, a partner at Avante Mezzanine Partners focused on the state of Mezz, and Steve Wiesner Sr VP from Evergreen Pacific Partners brought the state of Private Equity into focus for us.

Most of the panel agreed that while 2011 was a tough year for getting deals done, all agreed the pipeline heading into 2012 looks real promising. A big lesson from last year to roll forward from what I heard was re-learning the definition of “early disclosure” (being transparent) from start to finish. In other words, as a business Seller or borrower much more scrutiny was placed on getting your dirty laundry out in the open up front, not somewhere in the process when due diligence auditors uncover the ugly stuff that can kill a deal. Likewise, bankers and buyers were expected to sharpen their pencils and perform their own enhanced levels of pre-qualification and preliminary due diligence before engaging a borrower.

This upfront accountability is not completely new, but there is a lot more emphasis on not passing the buck when new clients enter the process. This is why I always advise owners to never hide any issues and hope they get overlooked. Because they seldom do — and perhaps something that could have been resolved in the early going, looks worse when it’s uncovered by others later. Good way to kill your deal and your credibility.

Most interesting to me from the panel was the discussion on current and expected interest rates for the type of money being borrowed or invested and the panel agreed, Sr lending rates are still low, but mostly for profitable businesses and owners who know how to manage through tough times. These rates according to Jason Horstman are still in the 3%-5% range for well qualified buyers, so to speak. The bank is eager to lend and expecting a busy year as conditions improve according to Horstman.

On the Mezzanine level where rates for unsecured debts are generally higher, the numbers to borrow came in as expected, in the low to mid teens, with leverage multiples (debt/ebitda) between 3x and 4x, not bad, especially if you need acquisition funding for a few years out. Jeri also noted an increase in ‘Unitranche’ deals. A Unitranche funding combines or rather blends a Sr lender’s (lower/secured rates) with a Mezzanine lender’s (higher/unsecured rates) all into a single lower rate, hence ‘uni’ trance rate. So let’s say you get a 5% Sr secured loan but need more. Adding a Mezzanine layer at 18% could be blended down to 10%. This is good news for many of you who may need both lending facilities to execute your 2012 strategy. The other interesting thing Jeri mentioned was an increasing level of respect and confidence lenders are showing to those business leaders who navigated the down turn. As conditions improve lenders are giving more credence to management teams that have proven they can manage the company in tough times, which is exactly what lenders feared most. This insight should give all surviving business owners more confidence this year to crawl out from their holes and borrow.

Lastly Steve Wiesner gave us the latest on the state of Private Equity backed funds going into 2012. As a buyer of business enterprises, Steve says buyers are paying higher EBITDA multiples for new acquisitions. This is in line with GF Data and other sources reporting EBITDA transaction multiples are back to pre-recession levels for firms over $50 mil in Enterprise Value, and not far behind pre-recession levels are multiples for firms under $50 mil EV. Steve’s bigger point may have been that we should expect to see less PE funds available overall in 2012 as 3-yr term vintage 2009 funds look to return un-deployed capital if the funds don’t find acceptable investment criteria targets soon. That’s the nature of the beast. But maybe less is better these days, you tell me. 

In conclusion, the ACG event was a welcoming outlook to a growing optimism for the business funding environment this year. Whether you are making an acquisition, selling a business, or looking to raise capital, ‘advance preparation’ may be the new buzz words in 2012, or better could make the difference in closing your deal, on your terms.

Rick Andrade

10 WAYS TO BOOST YOUR COMPANY’S VALUE: Practice #10: Review your Capital Structure

10 WAYS TO BOOST YOUR COMPANY’S VALUE

Practice #10: Review your Capital Structure

As you may know, Capital Structure is how a business finances itself using debt, equity, or other securities like bonds, etc. The key question I am often asked is “what is the best capital structure for my business?” The answer in part depends on which industry you are in, and if you are a ‘mature vs growth’ company in that industry. In either case it is important to make sure you are operating within typical industry guidelines for debt vs. equity ratios of comparable firms. If most companies in your industry have 40 percent debt on the books and you have 70 percent debt, your valuation could suffer even though your cash flows can meet interest obligations. Bankers, buyers and investors love to see standard metrics balanced across debt vs. equity in order to compare your firm’s future prospects with best in class companies in your industry.

As a result, business owners at all levels that try to maximize shareholder investment, do so generally by reducing their “Cost of Capital” which means that Debt as opposed to Equity is cheaper to finance operations and growth. The cost of debt is the interest rate, while the cost of equity is harder to calculate (using CAPM etc) but is generally the expected return your investor would have of a similarly risky venture. In most cases, making an illiquid investment in a middle market private company is considered a more risky investment, hence higher expected return (rate).

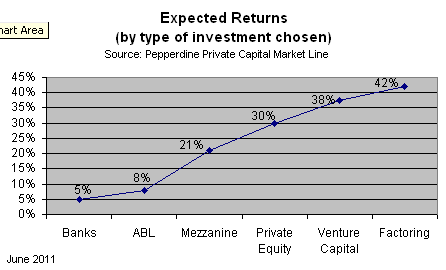
The easiest way to see this in action is to compare several types of funds by their costs of capital expected rates. Dozens of studies and analyses can be found that identify the cost of various capital options. One analysis by Robert Slee, professor of finance atPepperdineUniversitydelineated several types of capital you can choose from and the expected rates of return associated with each in the chart below.  The chart includes typical costs of capital for Bank Loans, ABL (Asset Based Lending), Mezzanine Lending, Private Equity, Venture Capital, and Factoring as of June 2011:

imsicap

As you can see, with the exception of Factoring, the cost of capital (expected return rates) increases as business owners move from lower cost bank lending on the left side to higher priced equity and venture capital investments on the right. Of course all companies want a lower cost of financing, however, while equity requires no monthly interest payments, the overall cost of selling (issuing) equity is higher. Hence the ideal Capital Structure is some combination of debt and equity. And by maximizing the cost of capital for your company you can improve the overall valuation of the firm.  Conversely a lop-sided Capital Structure can reduce the value of your company when compared to a more efficient competitor in the industry. 

If you don’t know which type of investment is best to fund your company, it is always best to consult with your commercial and investment banker for advice. Let them run the calculations for your specific firm lay out the options.  Remember; your target Capital Structure should be similar to industry benchmarks or better if possible.

10 WAYS TO BOOST YOUR COMPANY’S VALUE: Practice #9: Breed New Products

10 WAYS TO BOOST YOUR COMPANY’S VALUE

Practice #9: “Breed” new products

Most companies have cut R&D over the past few years to save money; however, this can be a losing strategy over the long term. Even one new successful product, if launched properly, can have lasting positive effects on company valuation. You don’t have to have the next Apple iPad up your sleeve, but “signaling,” or creating the impression that you are continuing to develop new products sends an important message to the market, competition, staff, and future investors who expect continuing innovation.

In addition, because suppliers may also be looking for new business opportunities, consider developing new products with suppliers as a combined R&D team effort.  Working with suppliers in R&D not only combines lower cost with better supplier relations; it also signals confidence internally and externally to retailers and customers that your business isn’t sitting around waiting for demand to improve.

Typical R&D budgets for an industrial sector company average 3.5 percent of sales, while high tech companies can start at 7 percent of sales and biotech firms can reach 40 percent or more. Having no R&D budget, on the other hand, is not only the kiss of death for the future, but also signals to everyone (including bankers, suppliers and customers) that your company is a one-product venture, and may not be around in the long term.

The consequences of no R&D translates to lower enterprise value, lower margins and lower competitive advantage in the market. While you may not see the wisdom of an R&D expense budget today, by next year you may find yourself out-maneuvered as competitors seize new market trends ahead of your expectations and at the expense of your profits and your future. Becoming a “breeder” of well designed new products exemplifies a commitment to growth, and can lead to a significant increase in business valuation over your competition.

In part 10 we look at Capital Structure, and why it’s a key to your success.

10 WAYS TO BOOST YOUR COMPANY’S VALUE: Practice #8: Reduce COGS expenses

10 WAYS TO BOOST YOUR COMPANY’S VALUE

Practice #8: Reduce COGS expenses

Rather than waiting for commodity prices to increase, take an overview of all your inputs to your cost of goods sold (COGS) per product. If you are a manufacturer, raw material price movements can dramatically affect profits from period to period. The way to win this battle and reduce COGS is to focus on the following:

  • Raw material input flexibility
  • Strong supplier relations
  • Process automation

Raw material input flexibility means you have tested new, cheaper raw material inputs with customers and found a sustainable quality alternative. If you generally buy large quantities of raw materials from the same supplier, ask that supplier to investigate cheaper high quality substitutes and experiment with these to see what works with customers. If your supplier doesn’t seem to be on the same page, investigate getting another supplier. Also consider signing a supplier contract with stipulated pricing for discounts on volume, and term of the agreement.

Ideally you should have deep supplier relationships where both you and the supplier have a significant stake in the outcome should something go wrong or input prices increase suddenly. Any supplier not willing to work with you is pause for concern in reducing COGS going forward. In fact, it is a best practice to have at least three suppliers for every key input material of COGS, enabling you to keep each one honest, productive and competitive when it comes to serving your needs.

Finally, consider your relative competitive position when it comes to process or “throughput” automation. This is the speed and cost of producing or completing a single product or service sale. Since capital costs are down in this economy, consider funding new equipment that can increase throughput substantially, reduce bottlenecks and gain a competitive edge going forward. Even though investing in capital projects in an uncertain economy is daunting, with all things considered, now is a good time to take advantage of equipment manufacturers’ and service providers’ discounts and financing, before a renewed consumer confidence increases prices.

Check in for part 9 on boosting company value by investing wisely in R&D.

10 WAYS TO BOOST YOUR COMPANY’S VALUE: Practice #7: Key Financial Ratios

10 WAYS TO BOOST YOUR COMPANY’S VALUE

Practice #7: Institute a means to track financial performance ratios

As banking relationships for middle market companies migrate from “rosy” to results, it’s important to know where you stand financially in the eyes of your bank in order to avoid a catastrophe. Here’s what I mean. Since the economic crises began, banks have been quietly tightening and restricting credit terms on nearly all their products, including lines of credit and Sr loan facilities. Unfortunately, many businesses did not become aware of the situation until it was too late. Many suddenly found themselves in violation of loan covenant terms or worse, cancelled exactly when they needed the money most.

To best know where you stand, the first thing is to call your banker and reconfirm the terms of your borrowings. Find out what has changed, and what metrics are being tracked more closely if you don’t already know. There are dozens of performance ratios that middle market businesses track monthly, and you can find most of them and their respective formulas here. http://highperformanceorganizations.net/FinancialRatios.pdf

However, from a bank lender point of view there are only a few key metrics generally in the form of written loan covenants they need to see regularly including: 

  1. Profitability – EBITDA (cash flow)
  2. Leverage – Debt to Equity ratio
  3. Liquidity – Current Ratio and Quick Ratio
  4. Working Capital –  Current Assets minus Current Liabilities
  5. Debt Service Coverage Ratio – Cash to cover interest payments

Of course, there are dozens of other performance and solvency metrics to calculate depending on your industry, banking and borrowing terms. In the past year, many businesses took too long to figure out what they needed to do in advance in order to meet the performance metrics for their bank. If you know sales are down don’t wait to contact your bank. Find out what can trigger a default and how to mitigate any adverse reaction beforehand if possible.

You should also compare your ratios to your competitors. You can find ratios for over 10,000 lines of business at www.BizMiner.com and you can use the calculators at www.Bankrate.com to get things started. Over the longer term as you grow consider as a best practice investing in a software solution that can automate and forecast business ratios quickly and easily, giving you time to react before a problem arises. And by showcasing that you are ahead of the game when it comes to transparently managing your business performance, you can increase the value of your business as compared to others that don’t.

Coming up in part 8, we will talk about reducing COGS expenses.

10 WAYS TO BOOST YOUR COMPANY’S VALUE: Practice #6: Reduce overhead expenses

10 WAYS TO BOOST YOUR COMPANY’S VALUE

Practice #6: Reduce overhead expenses

 One bright spot of the economic downturn is that it has forced many companies to look more closely at where overhead SG&A expenses are being spent. This is not simply headcount, but other indirect costs as well. The key metric to benchmark in a review of overhead expenses is how they compare to that of similar competitors.

 In an overhead review you should look for how well you have empowered managers to cut costs in each department and how well your company communicated guidelines and rules to enforce a discipline and structure to validate and verify overhead spending per department. There is a very good whitepaper from Kaiser Associates (http://www.kaiserassociates.com/wp-content/uploads/SGA-Optimization-Whitepaper_06.02.08.pdf) on SG&A issues to consider and how to structure your organization to better manage and control overhead.

 SG&A is not easy to reduce without first studying the impact on other functions of the business. The key point is to understand how SG&A drives profitability and then to establish benchmarks to measure progress each period. As many as 90 percent of companies who institute SG&A cuts, fail to sustain their cost-cutting three years after the cuts were implemented. The reason is that after sales and profits improve, many companies let new costs creep back into the mix. A best practice is to retool your company culture and develop a savings mindset that penetrates all areas. Encourage staff to think of costs as their own personal ROI value to your bottom line, rather than as benefits, perks and corporate freebies they deserve.

 Middle market and smaller companies can implement a cost conscious culture more easily than larger firms simply because of the personal touch smaller business owners can display in their own actions.  Employees want to see management is “walking the talk” when it comes to sharing the pain so to speak.

 Employee Stock Ownership Plans (ESOPs) have also been shown to increase employee awareness of expenditures for SG&A and to profitability when effectively implemented. If you would like to see how ESOP’s can work for you check out the ESOP Association: (http://www.esopassociation.org/about/about_association.asp).

 The bottom line on reducing SG&A expenses is to give every worker a stake in the outcome. Reward them for creating new ways to reduce costs and developing, over time, a culture that emphasizes thrift over spending. You will know you are on the right track when an employee asks “why are we spending money on this…”

 In part 7, I look at financial performance ratios.