Rick Andrade – Los Angeles, Ca.
On December 8th 1941, a day after the Japanese attack on Pearl Harbor and other Pacific islands, then President Franklin Delano Roosevelt decided to officially end America’s isolation from the growing war in Europe by signing a declaration of war on the empire of Japan.
At the time, that historical decision seemed to be a no-brainer. America was attacked, 3500 people were killed and the American public wanted payback. But there must have been much more to that decision than a few chosen words in the heat of passion. Have you ever wondered what key decision principles FDR considered before making that fateful decision? Did FDR use a personal decision-making process, or merely a list of Pros and Cons developed by his advisors to help quantify the long term risks of war?
On January 14th 1914, Henry Ford suddenly announced that he would double the daily wage of his factory workers from $2.34/day to $5/day. Many said Ford was crazy, that the increase cost of labor would bankrupt the company. But Ford was somehow convinced in his mind that the new wage would reduce turnover rates, reduce cost, and increase the output of auto production. A man of deep contradictions Ford wanted perhaps most to enable his own workers to actually afford the autos they made.
But while every other auto manufacturer was trying to reduce the cost of labor, Ford’s decision put the company’s future on the line. And by the end of the following year in 1915 Ford’s sales went from 300,000 units to more than 500,000 units, and by 1920 sales topped 1 million units. Ford was a genius. But how did he know that his decision to increase wages and shorten the workday would pay off when his advisors said no?
For decades I have been fascinated by how and why people can support making risky decisions in their life and in their business, especially when those decisions can have colossal impact on people in the line of fire so to speak. So I decided to take a closer look, and after some study of dozens and dozens of major decisions made by major decision-makers over time, I discovered that most ‘good’ decisions consider 6 common principles. I call these principles The 6 Key Principles of Decision, and (by way of first introduction here) developed and arranged them in a circular step-by-step easy to follow flow chart that made the most sense.
I call this new framework a “Decision Ring,” and by using it I discovered how CEOs in business and life can not only make better decisions going forward, but also learn how and why some prior decisions turned out so unexpectedly bad.
I identify the six key principles as ‘principles’ rather than “rules” because while a rule is meant to compel your actions, a principle is meant to motivate deeper thought.
Not often in business do CEOs have to make life or death decisions but often enough the key decisions they do make can dramatically affect the lives of employees and their families. In bad economic times most of these decisions come by way of layoffs in the face of declining sales, or a merger. More infrequent are those key business decisions like Henry Ford’s that can overnight change the lives of hundreds of assembly line workers.
Fast forward to April 2015, credit card processing company Gravity Payment’s CEO Dan Price decides to raise his company’s base annual salary to a minimum of $70,000, which gave raises to 70 staffers and doubled the salary of 30 more. His explanation; A Princeton study that showed employees who make more money have a greater sense of “emotional well-being.” And in turn that emotional well-being makes employees better at their jobs, and more productive. To me, that sounds like Henry Ford’s decision instincts at work.
Clearly today, in a time where technology is lowering the cost of labor and eliminating jobs altogether, raising wages seems counter intuitive. But is it? Well that depends on Principle #1: Developing the ‘Why.’ When Dan Price made his decision clearly he had an Expected Outcome in mind that employees at Gravity Payments would happily stick with the company longer, and produce greater returns; a risky move right?
In other words, it hardly matters that an important decision be a matter of life, death, hiring, firing or giving everyone a big fat raise. Because what really matters is that the decision-maker includes all six principles and the weighted risk that each brings to the table before pulling the trigger. In business, more of this approach is evident in practice because most CEOs look for consensus from a Board of Directors; implicitly a contemplative decision-making body. But often enough many leaders must take it on themselves to make key decisions, knowing all too well that going it alone and getting it wrong can have widespread consequences, both in life and business, and it is for these decision makers that I created the Decision Ring.
So what is a Decision Ring and how is it used? Let’s take a closer look.
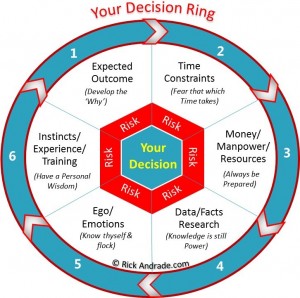
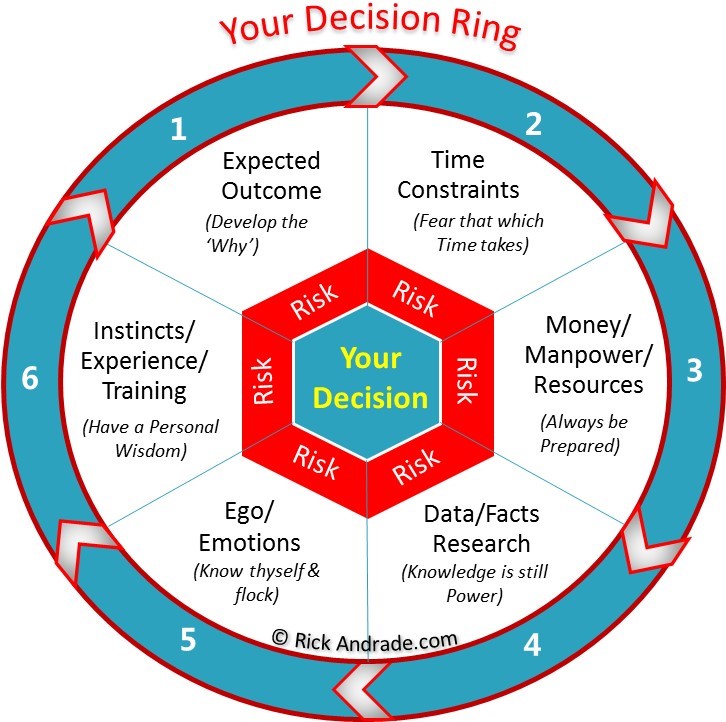
A Decision Ring is exactly like it sounds, it’s a circular closed loop process inside which stands the 6 Key Principles linked to the associated ‘Risk’ that surrounds ‘Your Decision’ at the ring’s center. Each associated risk factor goes up or down based upon the level of confidence you have in overcoming the downside risk each principle exposes in your decision. Each Principle is then linked to a list of questions to ask and answer as shown:
The idea is to start at Principle #1 Developing the ‘Why” which is the Expected Outcome of your decision. This before moving on to Principle #2 Fear that which Time Takes which is to understand (good or bad) your decision’s particular Time Constraints, etc, on around the Decision Ring engaging each principle all the while revising the ‘Why’ (your Expected Outcome), each step along the way.
In my experience, using this approach can help ensure that no significant factor in your key decision goes over-looked or over-emphasized. Used properly, the Decision Ring framework can be used as both a tool and a process to ensure that the decision-maker and/or advisory team is indeed considering all 6 principles in the expected outcome, and not just one or two as the case may be.
Consider this simple example. A couple decides to get married and wants to live happily ever after. But as we know, the chances are high that an imbalance will occur among the 6 principles in the decision ring because most couples will rely heavily on Principle #5 – their ‘emotions’ to achieve their expected outcome. And this makes sense as most couples “expect” the outcome to be a long-loving marriage, at least upfront. But then why do 50% of all American marriages end in divorce? Ask them ‘why’ and most divorced couples will admit it wasn’t a good fit after all, or, they acted on impulse and didn’t think it through enough. So does that mean all future marriage partners should spend more on a “Wedding” Decision Ring before platinum or gold? Maybe. It probably couldn’t hurt, right? Well then what about business-to-business marriages? Could they use an M&A Decision Ring to avoid a bad break-up too? Lets see…
On January 10th, 2000 AOL and Time Warner announced they too would be married. That combination was valued at more than $350Bil including debt according to reports. Back then the internet was quickly evolving and the new “dot com” craze was in full swing. Jerry Levin CEO of Time Warner seemed to panic, faced with a real dilemma on how a giant content owning and producing media company should advance in an online world.
At the time AOL, headed by former marketing consultant CEO Steve Case, was a huge hit with internet newbies by leveraging its “You’ve Got Mail” email system and easy-access online portal. In 2000 AOL had 20+ million subscribers and the money-losing company was valued by Wall Street at an astonishing $163 Bil (sound familiar?), twice the size of Time Warner in market cap. So then why did this merger fail? What did that Decision Ring look like to Jerry Levin back then, and what were the key drivers that lead to the final decision to accept the AOL offer only to later find it was according to Jeff Bewkes, who became Time Warner CEO in 2008, ‘the biggest mistake in corporate history,’ as a host of issues conspired to make it fail?
Let’s take a quick look at our Decision Ring and see if we can spot the trouble.
Principle #1 Developing the Why; the Expected Outcome was that Time Warner would be able to sell all its content to millions of AOL subscribers and hence both subscribers and earnings would increase dramatically, thus increasing the market cap of the marriage to an eye-popping $350Bil. To the two CEOs at the time this was likely a good enough reason to do the deal alone. So let’s move on.
Principle #2 Fear that which Time takes; and know your Time Constraints. In 2000, the internet was young, and just getting access to it was a hot pursuit for Americans. In fact, the “adoption rate” (speed) by which Americans wanted to gain access to the internet was unprecedented. Unlike nearly any time in history Americans were “dialing up” the internet to see the future unfold. This was pretty powerful stuff back then. So the pressure to identify and secure a go-forward strategy was at a fever pitch.
Principle #3 Always know your Numbers; this includes Money/Manpower and Resources to either complete the deal, or survive a failure. So was this principle considered? Both AOL and Time Warner had plenty of stock value to do a deal. And given all the dot com rage back then, AOL seemed like both an online juggernaut, and future cash cow. To them the numbers seemed to pencil out.
Principle #4 Knowledge is still Power; and here is where the deal blows up in my view and had they used a Decision Ring it would have been obvious. It’s the technology stupid. At the time AOL was using first generation internet access called “dial up” which uses old-fashion telephone wires. Copper telephone wires made access slow, and content downloads repeatedly difficult to complete. Meanwhile regional cable companies were experimenting with something new: ‘Broadband’ cable internet access. I know this personally because I was living in one of the first cities in the country (back in 1996) to get ‘online’ using broadband cable vs telephone-line ‘dial-up’ service. The download speed difference between the two was nothing less than game-changing.
Broadband (cable) technology enabled users to download internet files at a lightning 10Mbits (bits per second) back then. While dial-up (before DSL) was painfully slow at 56kbit/s (bits per second). And once the word got out, AOL was in trouble. Subscriber growth declined fast, and AOL had few technology advances in place to stop the bleeding and increase dial-up speed to its millions of subscribers. And once the dot com bubble burst, the marriage was in trouble.
Principle #5 Know thyself & flock; because your Ego and Emotions can take logic and reason away from you faster than you think. And, at the time the AOL-Time Warner merger was the largest in recorded history. The attention to that alone must have been quite an ego boost to Levin and Case. This was a first of its kind marriage between of the real world and the online world. No one really knew what to expect other than when all was approved by the FTC and SEC, the combined company would have a market value of more than $350Bil. Acting on ego or emotion alone can turn a good merger into a nightmare. But you can recover as many do given the other 5 Principles achieve the Expected Outcome for you.
Principle #6 Have a Personal wisdom; that stems from your Instincts/Experience & Training. This one is the hardest because your instincts are generally based upon your prior experience and training. Remember the phrase “been there done that?” In this case, given the sense of urgency to button-up AOL before another company did, perhaps, over-shadowed the fact that AOL was entirely overvalued, and that its true value in the future was being brought forward at a premium valuation based on old technology. That should have been THE major risk factor and maybe it was, but dot com hysteria back then was too strong of a force to let wisdom reign.
Which brings us full circle; to me the merger was a huge mistake, and history proved it so. But for what was a financial and cultural disaster, could have been avoided if CEO Levin and his Board of Directors used a Decision Ring process. So my advice here is to get your arms around your decision-making process by building out a Decision Ring that addresses the key questions behind each principle, and measures the risk and degree of confidence within each before you put your company and the lives of many people on the line. Do that and there’s a good chance that you too will find more reasons and better confidence to support and communicate to all ‘Why’ your major decisions in life and business turned out so well.
Until then, stay tuned for more about Decision Rings in the weeks ahead as I apply the framework to some of history’s most famous decisions and the decision-makers behind the scenes who risked it all to make it happen.
———-
About the author: Rick Andrade is an investment banker at Janas Associates in Pasadena, Ca and finance writer in Los Angeles helping CEOs buy, sell and finance middle market companies. Rick has earned his BA and MBA from UCLA along with his Series 7, 63 & 79 FINRA securities licenses. He is also a Real Estate Broker, a volunteer SBA/SCORE instructor, and blogs at www.RickAndrade.com on issues important to middle market business owners. He can be reached at RJA@JanasCorp.com. This article is for informational purposes only and should not be considered in any way an offer to buy or sell a security. Securities are offered through JCC Advisors, Member FINRA/SIPC.

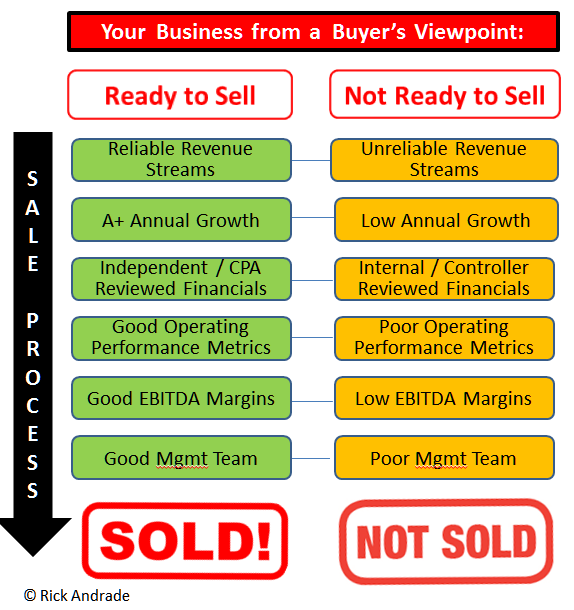


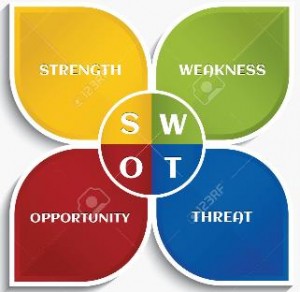 n Resource investments need more attention. For example, is a lower performing corporate division a result of a poor product line, or poor management skills? A buyer could easily ask you or your investment banking team for a senior staff SWOT analysis during due diligence. But why wait until then? Do a Management Team SWOT now, in advance of your exit. Be honest with key staff, and be ready to make changes now while you are in control. Most buyers will look to weigh the pros and cons of your management team’s skillsets heavily in their value calculation of your business.
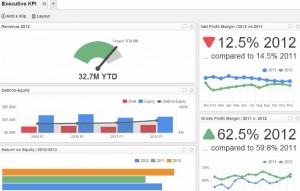 Executive Dash Board (EDB). This does not have to be an expensive software commitment. But by having a robust and accurate EDB process alone indicates to buyers your commitment to knowing your numbers. This includes having access to data a few clicks away such as EBITDA margins, gross margins, product margins, inventory turns, customer turns, and budget forecasts. Each industry has its own set of common benchmark performance metrics that it values most, and a buyer will know them too. Even more, a buyer may know your competitors’ performance metrics and how they benchmark against “best practices” in the industry. A good EDB software package is well worth the investment pre-sale because it can track (in near real time) dozens of KPIs (key performance indicators) and can help executives make better decisions more timely and effectively. If you already have an EDB your company is already ahead of the game, and can be perceived as having a higher value.


 troit January 5th, 1914 Henry Ford made a decision that would change history. He decided to pay his assembly workers more than twice the going $2 per day wage at the time in a desperate attempt to stem worker turn-over, and reduce errors fast.